Both value chain and customer journey maps discussed in the previous article will help you identify internal processes and improvement opportunities, but how do you decide which process automation opportunity to focus on first?
Automation Heat Map
An automation heat map can help you prioritize processes and activities that are good potentials for digital automation.
A great example of such an automation map can be found in McKinsey’s report “Where machines could replace humans—and where they can’t (yet)” [1]. The report uses an automation heat map to show the technical potential of automation in different sectors in the US.
Figure 1 shows a slightly modified version of the automation heat map for process automation purposes. It has two dimensions:
- Time Spent (%): This captures how much time is spent on a particular type of activity in a process and is represented by the size of the circle.
- Technical Feasibility (%): The second dimension captures technical feasibility of an activity or process being automated. This is represented by different colors.
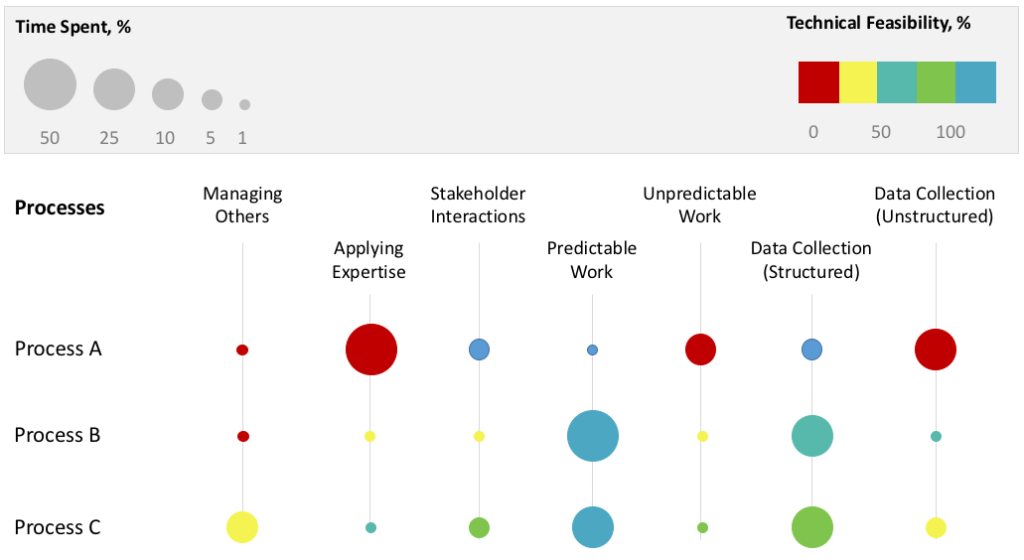
Figure 1 – Process Automation Heat map
The table below provides a brief analysis of information presented in Figure 6.
| Process A | The majority of activities require someone to apply their expertise and working with unstructured data. Given current technologies the potential of automation is low. |
| Process B | Most of the work is predictable and a lot of time is spent on processing structured data so the potential for automation is high. |
| Process C | Even though the amount of time spent on predictable work and processing structured data is less in comparison to Process B, but the technical feasibility of automation is high. |
You can always add or change the criteria that are more suitable for your organization.
References
- Where machines could replace humans—and where they can’t (yet) – McKinsey Quarterly